Denunciar publicación
Artículos relacionados
El bitcoin alcanza su máximo tras las elecciones y se acerca a los 100.000 dólares2024-11-21 23:35:15Bitcoin ha alcanzado un máximo postelectoral, rondando la marca de los 100.000 dólares, lo que demuestra su resiliencia y potencial de crecimiento. Además, se han incluido opciones de ETF al contado de Bitcoin, lo que brinda a los inversores más vías para acceder al mercado de las criptomonedas. En medio de estos rumores, Estados Unidos está contemplando la creación de una reserva estratégica de Bitcoin, insinuando una mayor integración de los activos digitales en las finanzas tradicionales. Manténgase actualizado sobre las últimas noticias y tendencias de Bitcoin aquí.

Bitcoin supera los 94.000 dólares: un récord histórico2024-11-20 00:55:26Bitcoin ha alcanzado un nuevo máximo histórico, alcanzando el hito de los 94.000 dólares. Los inversores están entusiasmados con la disponibilidad de nuevas opciones de ETF al contado de Bitcoin. Además, circulan rumores de que Estados Unidos podría estar construyendo una reserva estratégica de Bitcoin. Descubra los últimos avances en el mundo de las criptomonedas y cómo podrían afectar sus inversiones. Manténgase a la vanguardia y aprenda más sobre estos interesantes avances en Bitcoin y las finanzas. No te pierdas las últimas noticias y análisis sobre el futuro de las monedas digitales.
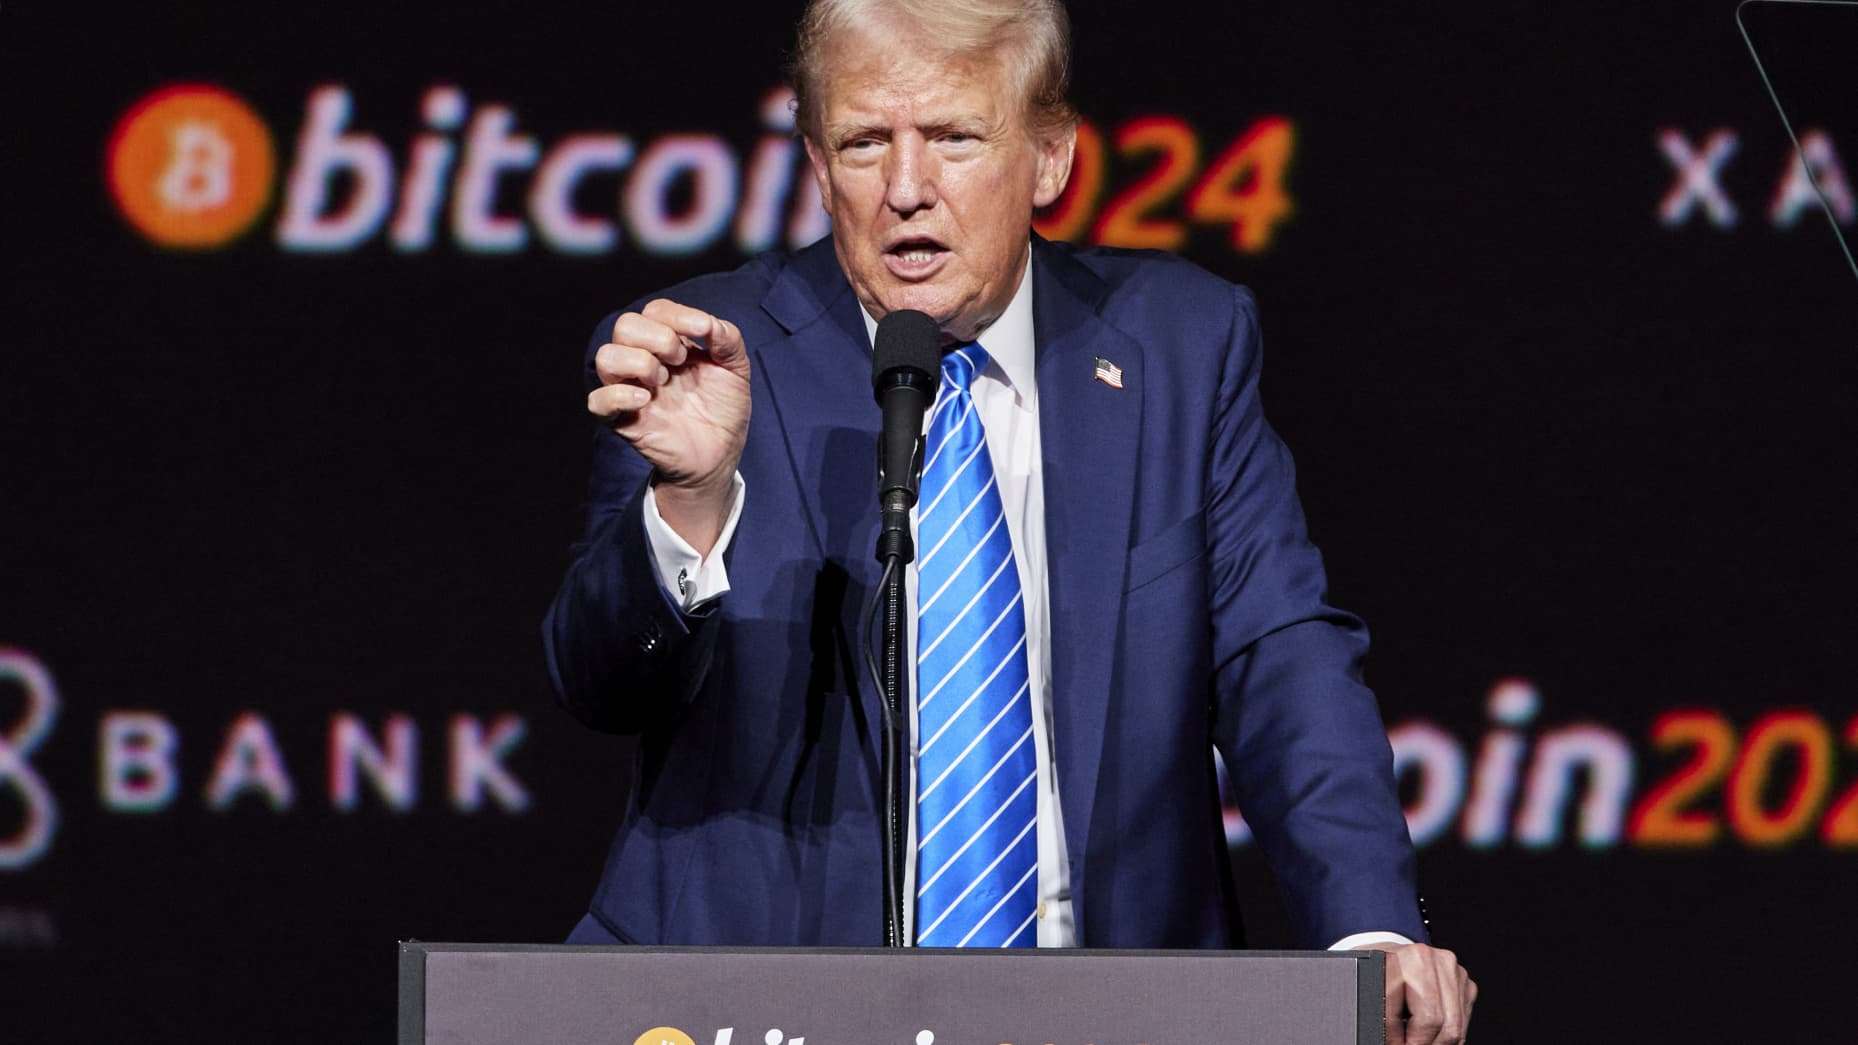
Bitcoin alcanza un nuevo récord: supera los 88.000 dólares en su último repunte2024-11-12 00:37:01Bitcoin ha alcanzado un nuevo máximo histórico, superando la marca de los 88.000 dólares en su último repunte. Con las elecciones a la vuelta de la esquina, los inversores se preguntan cómo afectarán a los mercados tradicionales. ¿Podría la campaña de Trump indicar un cambio en su postura sobre las criptomonedas? Mientras Trump y otras figuras políticas sopesan sus opciones, el mundo de las criptomonedas observa de cerca. Estén atentos a las actualizaciones sobre el ascenso de Bitcoin, los impactos electorales y los posibles cambios en las opiniones políticas sobre las monedas digitales.

El bitcoin alcanza un nuevo máximo y supera los 75.000 dólares en medio de la ventaja de Trump en las encuestas a pie de urna en EEUU2024-11-06 06:22:32Bitcoin alcanza un nuevo máximo, superando los 75.000 dólares en medio de las primeras encuestas a pie de urna en Estados Unidos que muestran la ventaja de Trump. Surgen dudas sobre si Trump obtuvo victorias en 14 estados durante las elecciones. El mercado de las criptomonedas está en auge, con Bitcoin a la cabeza. Los inversores se preguntan si Bitcoin alcanzará un nuevo máximo histórico, ya que la incertidumbre política alimenta la especulación en el espacio de los activos digitales. Estén atentos a las últimas actualizaciones sobre la acción del precio de Bitcoin y su posible trayectoria futura.

¿Qué es Cosmos? Lo que debes saber sobre ATOM2024-08-30 16:00:43Datos sobre Cosmos Abreviatura ATOM Categoría ‘In […]
